High availability during node and zone failures
The following example demonstrates how YugabyteDB can continue to perform reads and writes even in case of node failures. In this scenario, you create a universe with a replication factor (RF) of 3, which allows a fault tolerance of 1. This means the universe remains available for both reads and writes even if a fault domain fails. However, if another were to fail (bringing the number of failures to two), writes would become unavailable on the universe to preserve data consistency.
The examples are based on the YB Workload Simulator application, which uses the YugabyteDB JDBC Smart Driver configured with connection load balancing. The driver automatically balances application connections across the nodes in a universe and re-balances connections when a node fails.
Set up a universe
Follow the setup instructions to start a single region three-node universe, connect the YB Workload Simulator application, and run a read-write workload. To verify that the application is running correctly, navigate to the application UI at http://localhost:8080/ to view the universe network diagram, as well as latency and throughput charts for the running workload.
Observe even load across all nodes
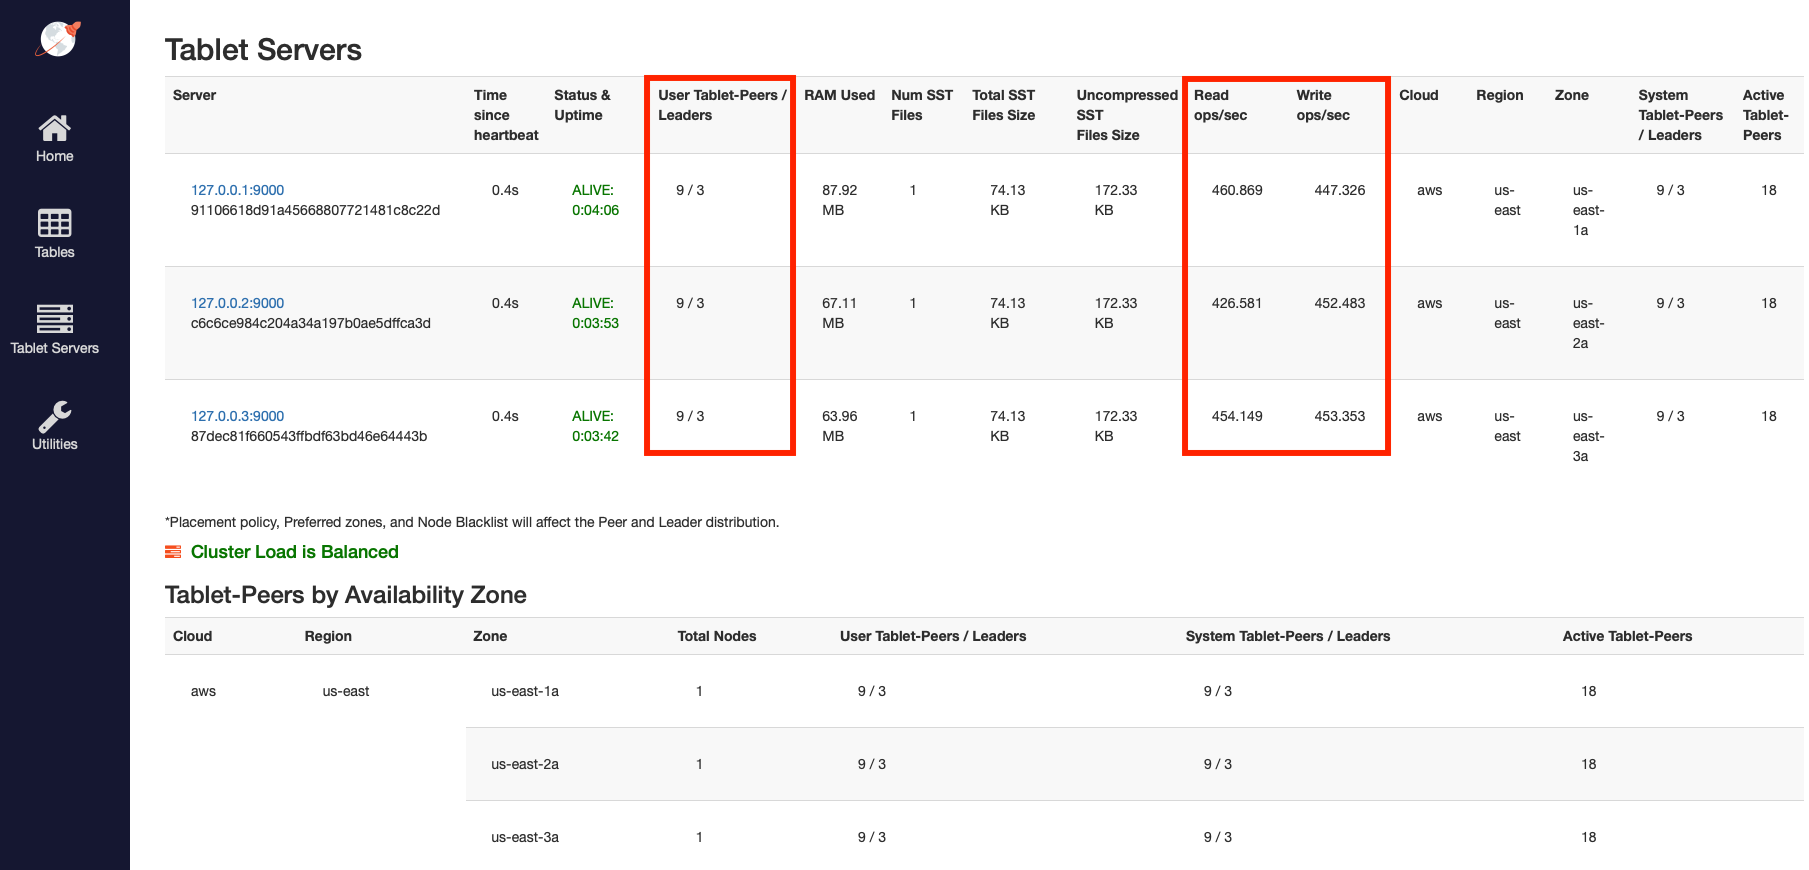
To view a table of per-node statistics for the universe, navigate to the tablet-servers page. The following illustration shows the total read and write IOPS per node:

Notice that both the reads and the writes are approximately the same across all nodes, indicating uniform load.
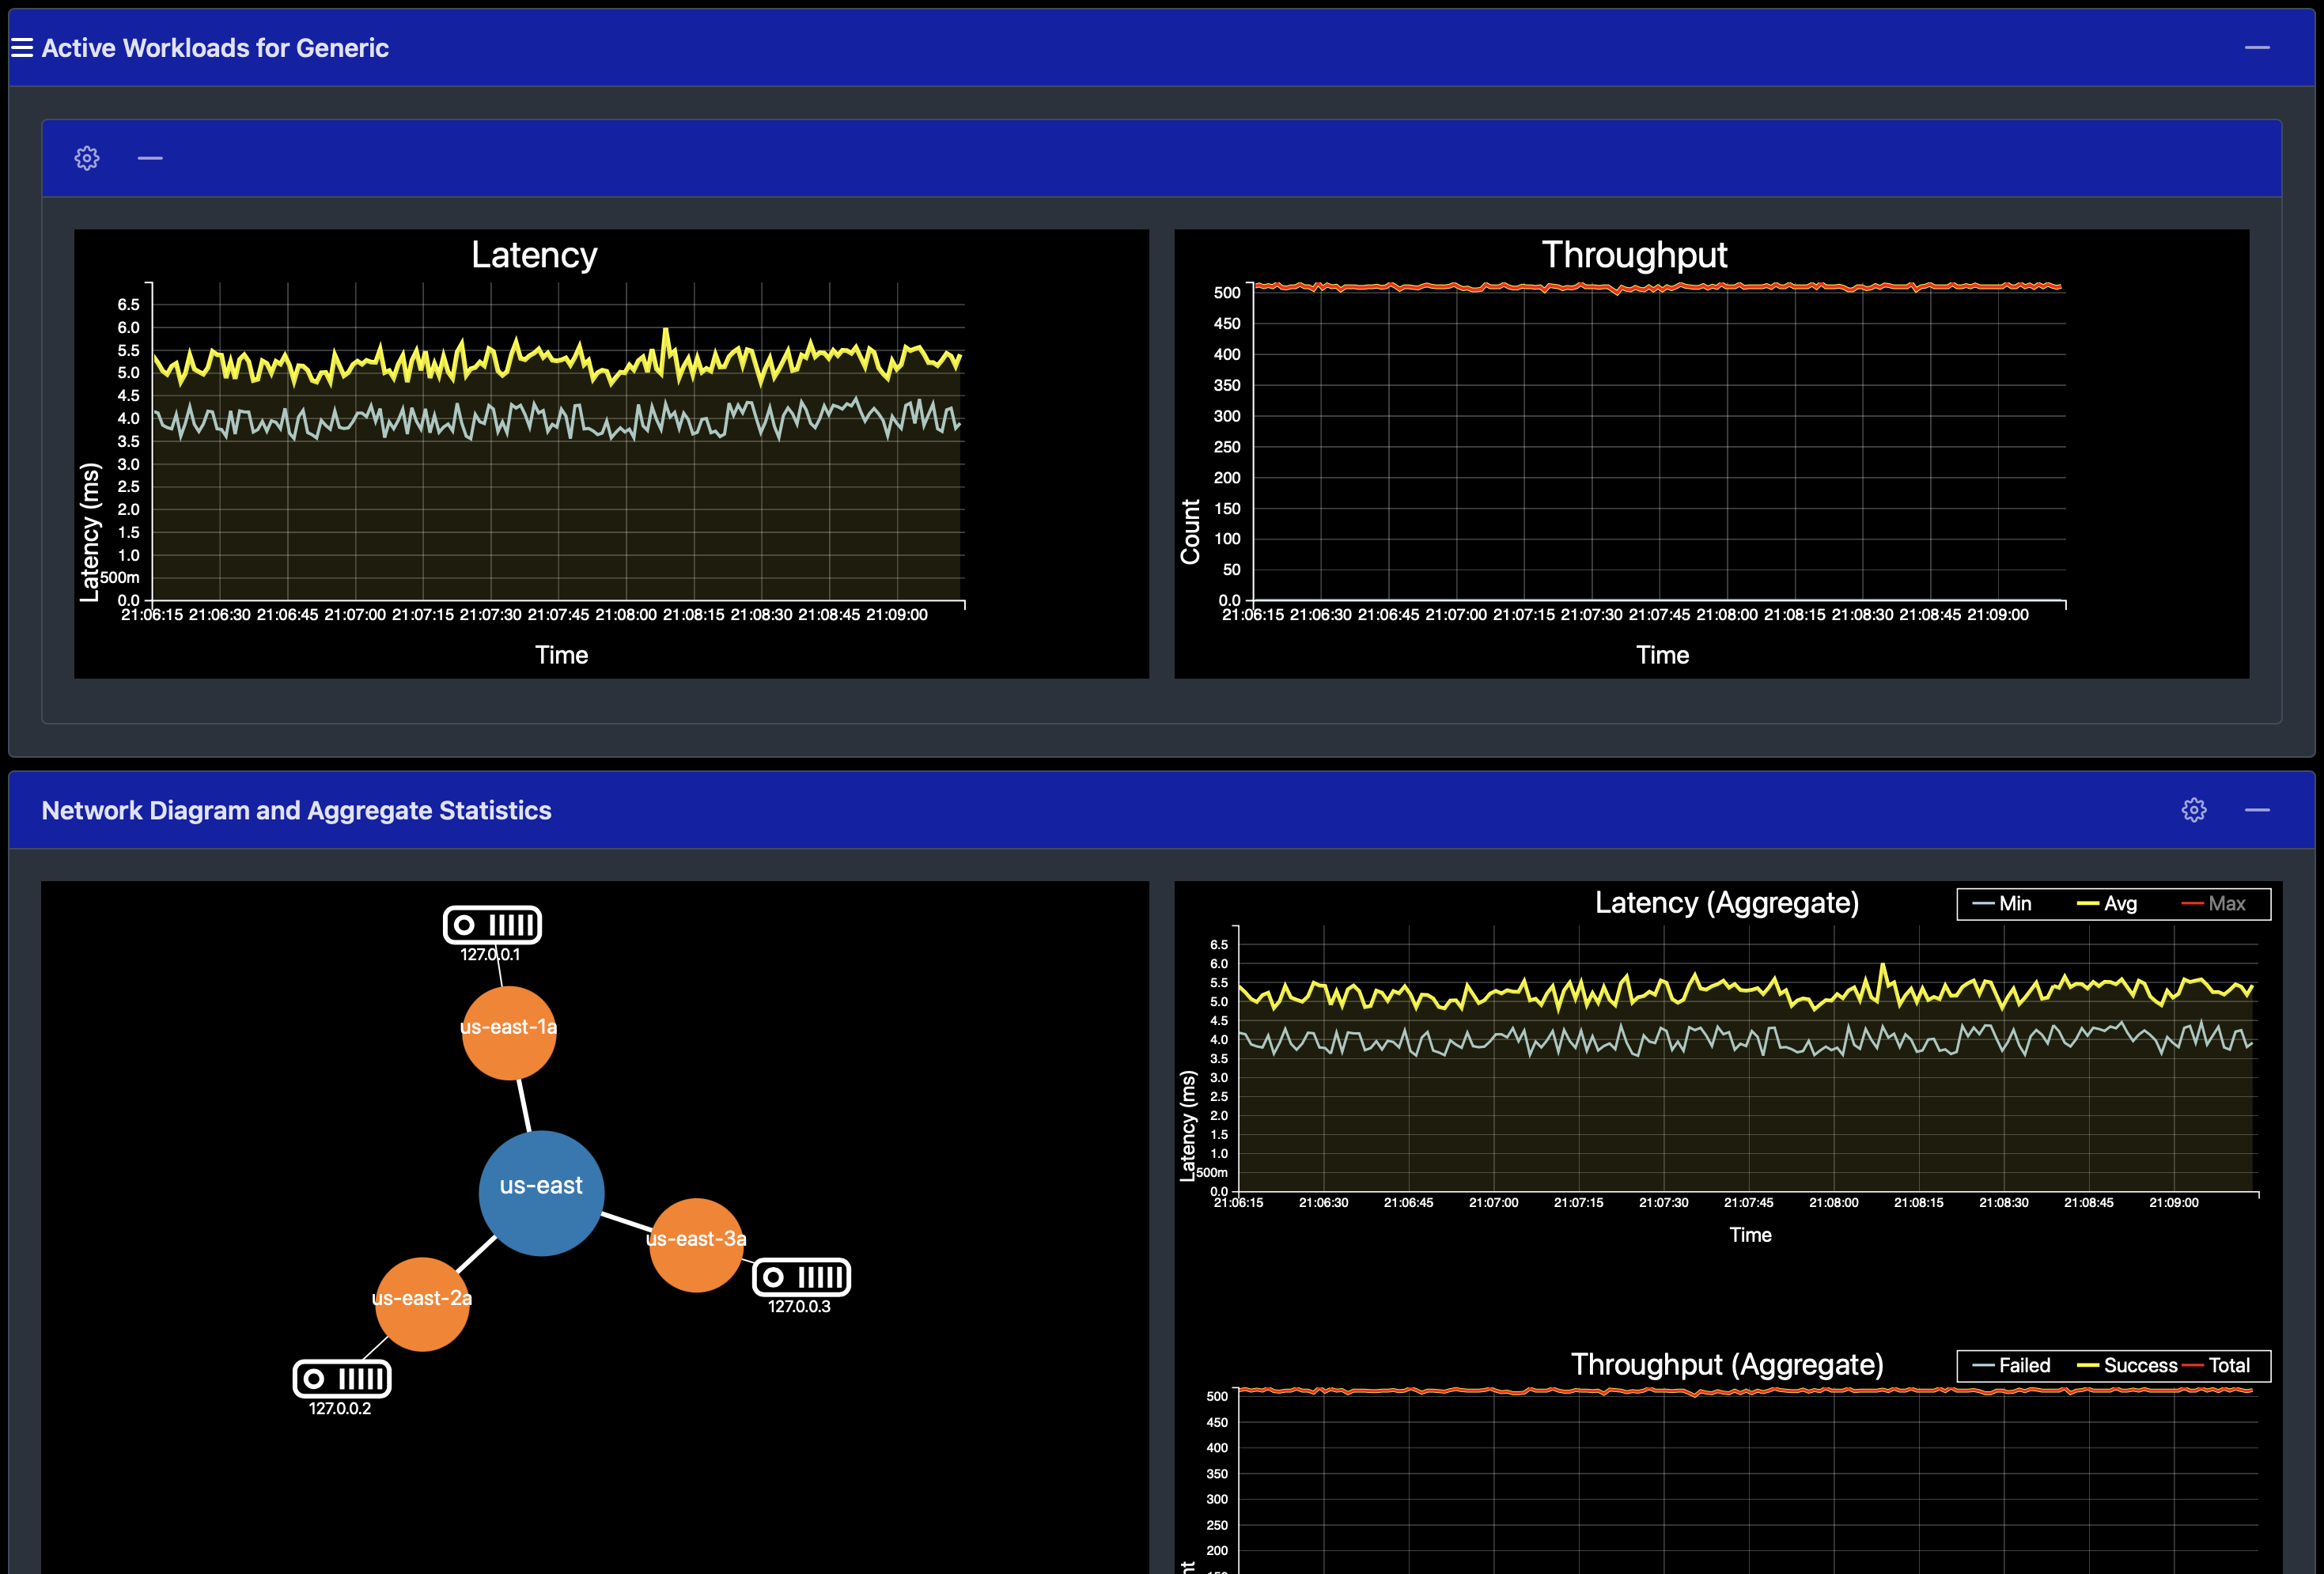
To view the latency and throughput on the universe while the workload is running, navigate to the simulation application UI, as per the following illustration:

Simulate a node failure
Stop one of the nodes to simulate the loss of a zone, as follows:
./bin/yugabyted stop --base_dir=/tmp/ybd2
Observe workload remains available
Refresh the tablet-servers page to see the statistics update.
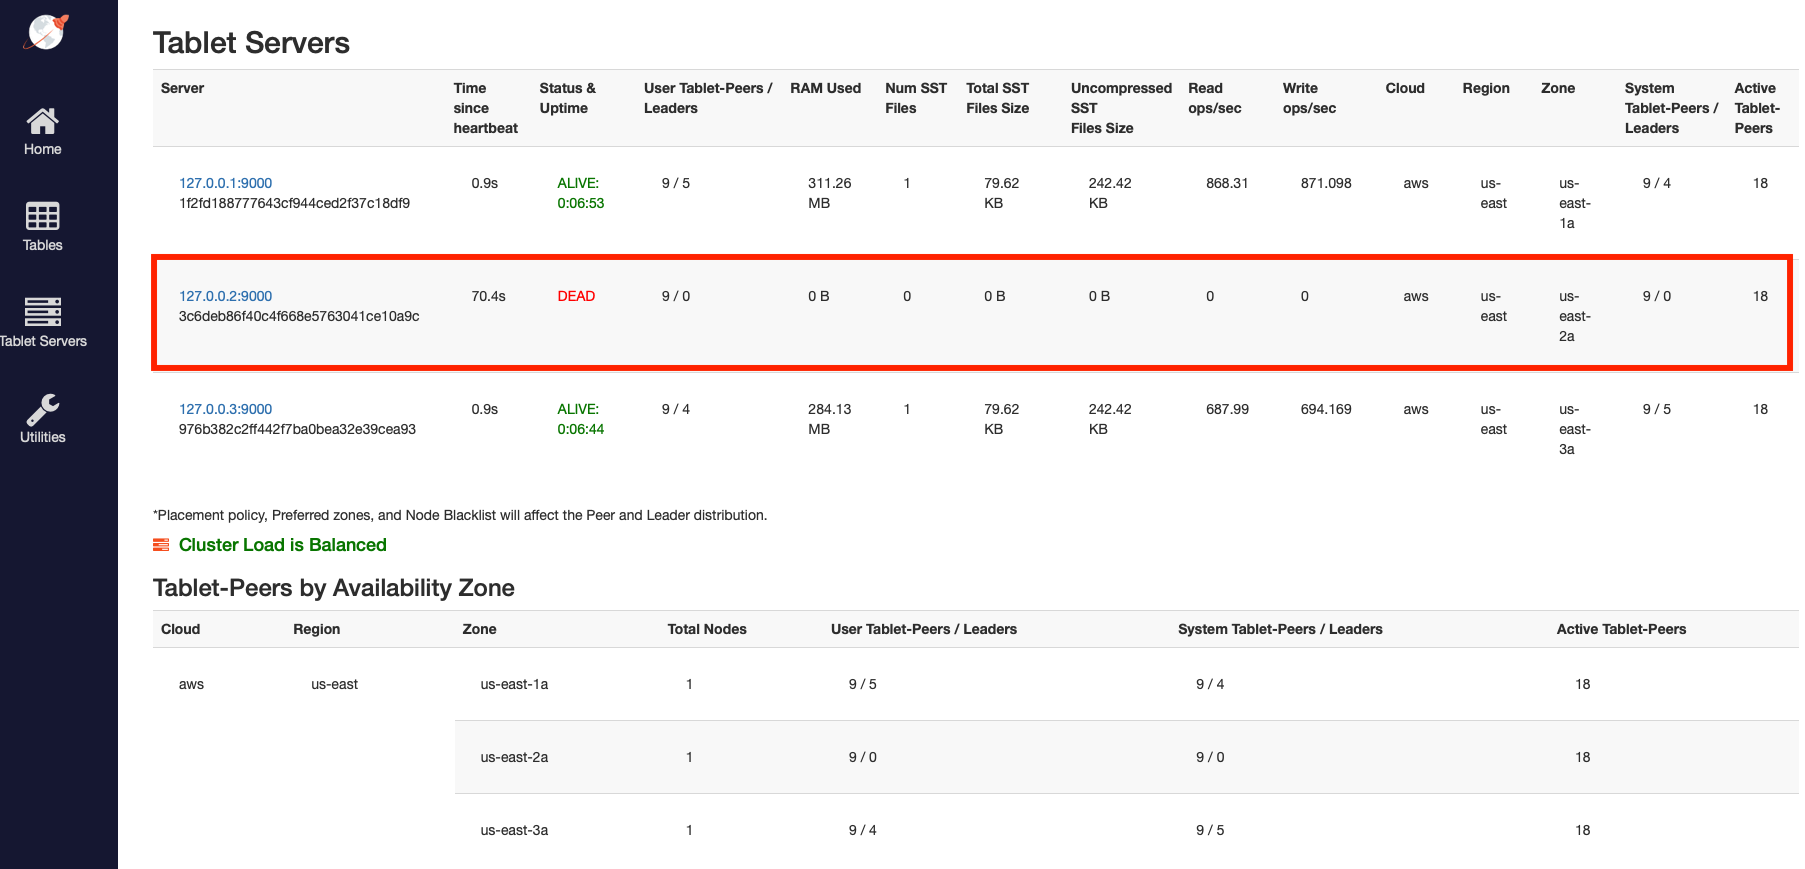
The Time since heartbeat value for that node starts to increase. When that number reaches 60s (1 minute), YugabyteDB changes the status of that node from ALIVE to DEAD. Observe the load (tablets) and IOPS getting moved off the removed node and redistributed to the other nodes, as per the following illustration:

With the loss of the node, which also represents the loss of an entire fault domain, the universe is now in an under-replicated state.
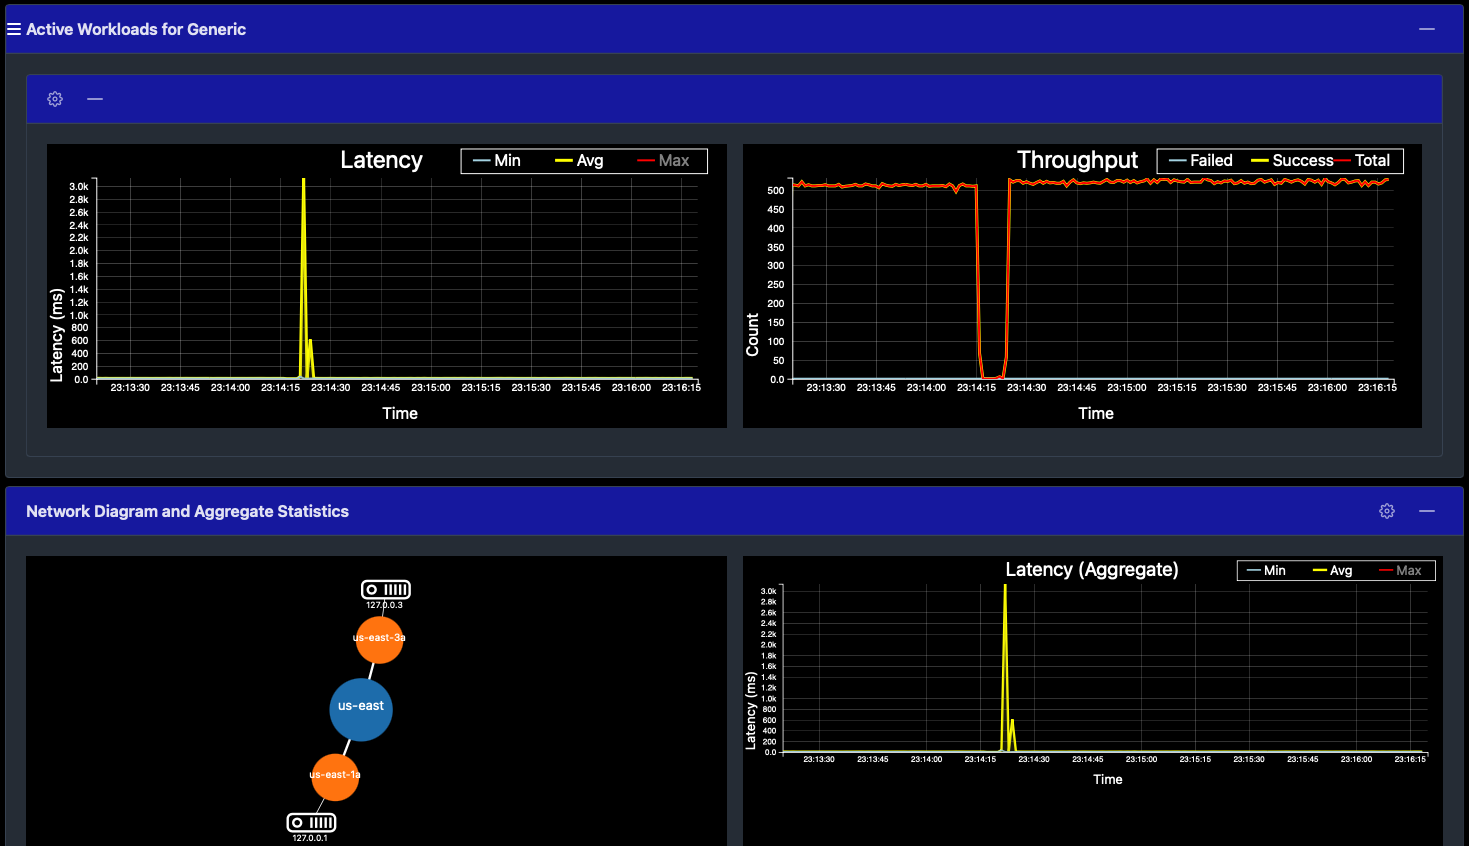
Navigate to the simulation application UI to see the node removed from the network diagram when it is stopped, as per the following illustration:

It may take close to 60 seconds to display the updated network diagram. You can also notice a spike and drop in the latency and throughput, both of which resume immediately.
Despite the loss of an entire fault domain, there is no impact on the application because no data is lost; previously replicated data on the remaining nodes is used to serve application requests.
Clean up
You can shut down the local cluster by following the instructions provided in Destroy a local cluster.