Metrics
YugabyteDB provides nearly two thousand metrics for monitoring, performance-tuning, and troubleshooting system, table, and tablet issues. Use metrics to monitor and manage clusters, troubleshoot performance issues, and identify bottlenecks.
YugabyteDB exports metrics through various endpoints in JSON, HTML, and Prometheus formats. For more information, see Metric endpoints.
This section describes the most frequently used metrics, along with how you can consume them.
For information on query tuning, refer to Query tuning.
Frequently used metrics
To learn about some of the categories of metrics and how to use them for your use case, refer to the following. Note that these sections cover only the most frequently used metrics and is not an exhaustive list of all the metrics exported by YugabyteDB.
| Topic | Description |
|---|---|
| Throughput and latency | YSQL query processing and database IOPS. |
| Connections | Cumulative number of connections to YSQL backend per node. |
| Cache and storage subsystems | Storage layer IOPS, block cache, bloom filter, SST file, compaction, memtable, and write ahead logging metrics. |
| Raft and distributed systems | Raft operations, throughput, and latencies, clock skew, and remote bootstrap. |
| YB-Master | Table and tablet management. |
| Replication | Replication lag. |
Metric naming conventions
Metrics use the following naming convention:
<metric_category>_<server_type>_<service_type>_<service_method>
Note that while this naming convention is generally adopted, YugabyteDB exports other server metrics which do not conform to the syntax.
| Category | Description |
|---|---|
| metric_category | Optional. Can be one of the following:
|
| server_type | Describes the type of server that originated the metric, and can be one of the following:
|
| service_type | The logical service name for a given server type. |
| service_method | Optional. Identifies service methods, which are specific functions performed by the service. |
Metric endpoints
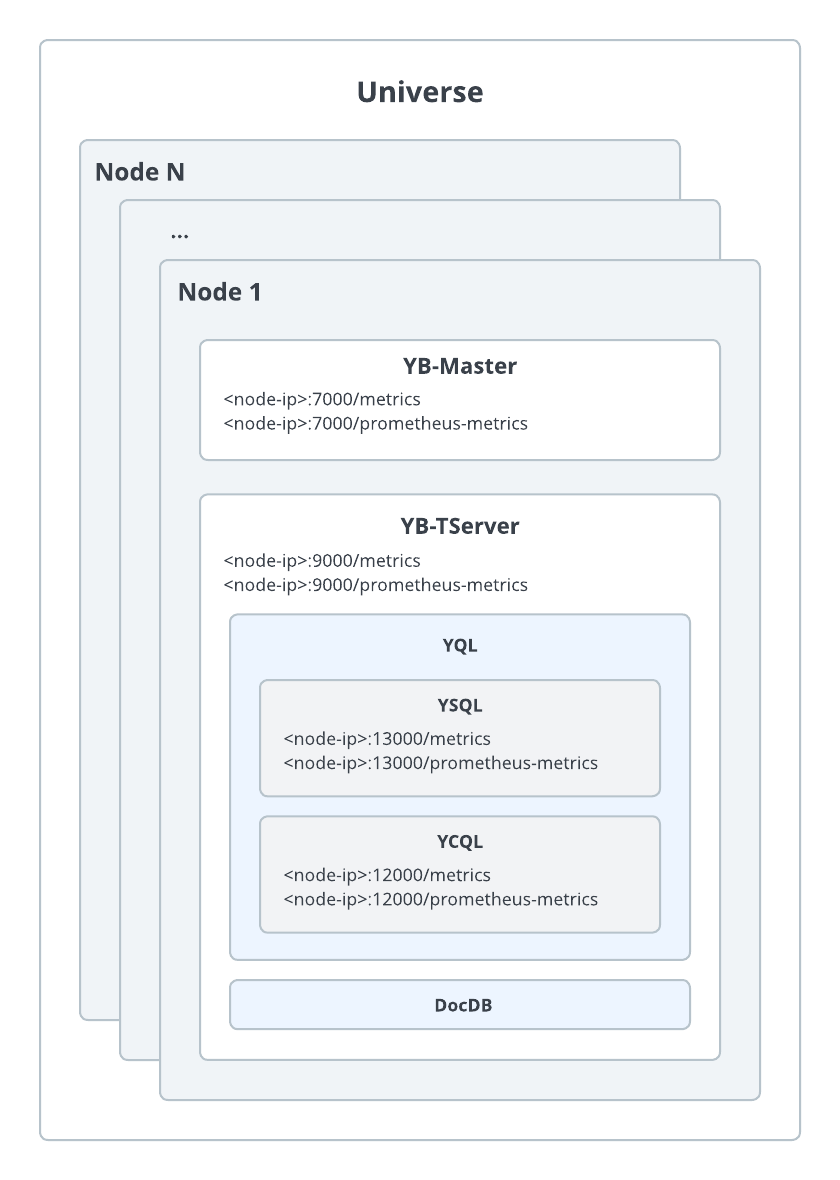
A YugabyteDB cluster comprises multiple nodes and services, each emitting metrics. Metrics can be for an entire cluster, or for a specific node, table, or tablet, and they can be aggregated into cluster, node, database, and table views. YugabyteDB has four major types of metrics per node: Server, Table, Tablet, and Cluster. Metrics are exported through various endpoints in JSON, HTML, and Prometheus formats, as shown in the following diagram.

The following table describes the types of metrics exposed by each endpoint and the URL from which their metrics can be exported.
| Service | Description | JSON | Prometheus |
|---|---|---|---|
| YB-Master | Metrics related to the system catalog, cluster-wide metadata (such as the number of tablets and tables), and cluster-wide operations (table creations/drops, and so on). | <node-ip>:7000/metrics |
<node-ip>:7000/prometheus-metrics |
| YB-TServer | Metrics related to end-user DML requests (such as table insert), which include tables, tablets, and storage-level metrics (such as Write-Ahead-Logging, and so on). | <node-ip>:9000/metrics |
<node-ip>:9000/prometheus-metrics |
| YSQL | YSQL query processing and connection metrics, such as throughput and latencies for various operations. | <node-ip>:13000/metrics |
<node-ip>:13000/prometheus-metrics |
| YCQL | YCQL query processing and connection metrics, such as throughput and latencies for various operations. | <node-ip>:12000/metrics |
<node-ip>:12000/prometheus-metrics |
System-level metrics are not exposed by YugabyteDB and are generally collected using an external tool such as node_exporter if using Prometheus.
If you use products that automate metrics and monitoring (such as YugabyteDB Anywhere and YugabyteDB Managed), node-level metric collection and aggregation to expose key metrics is provided out-of-the-box.