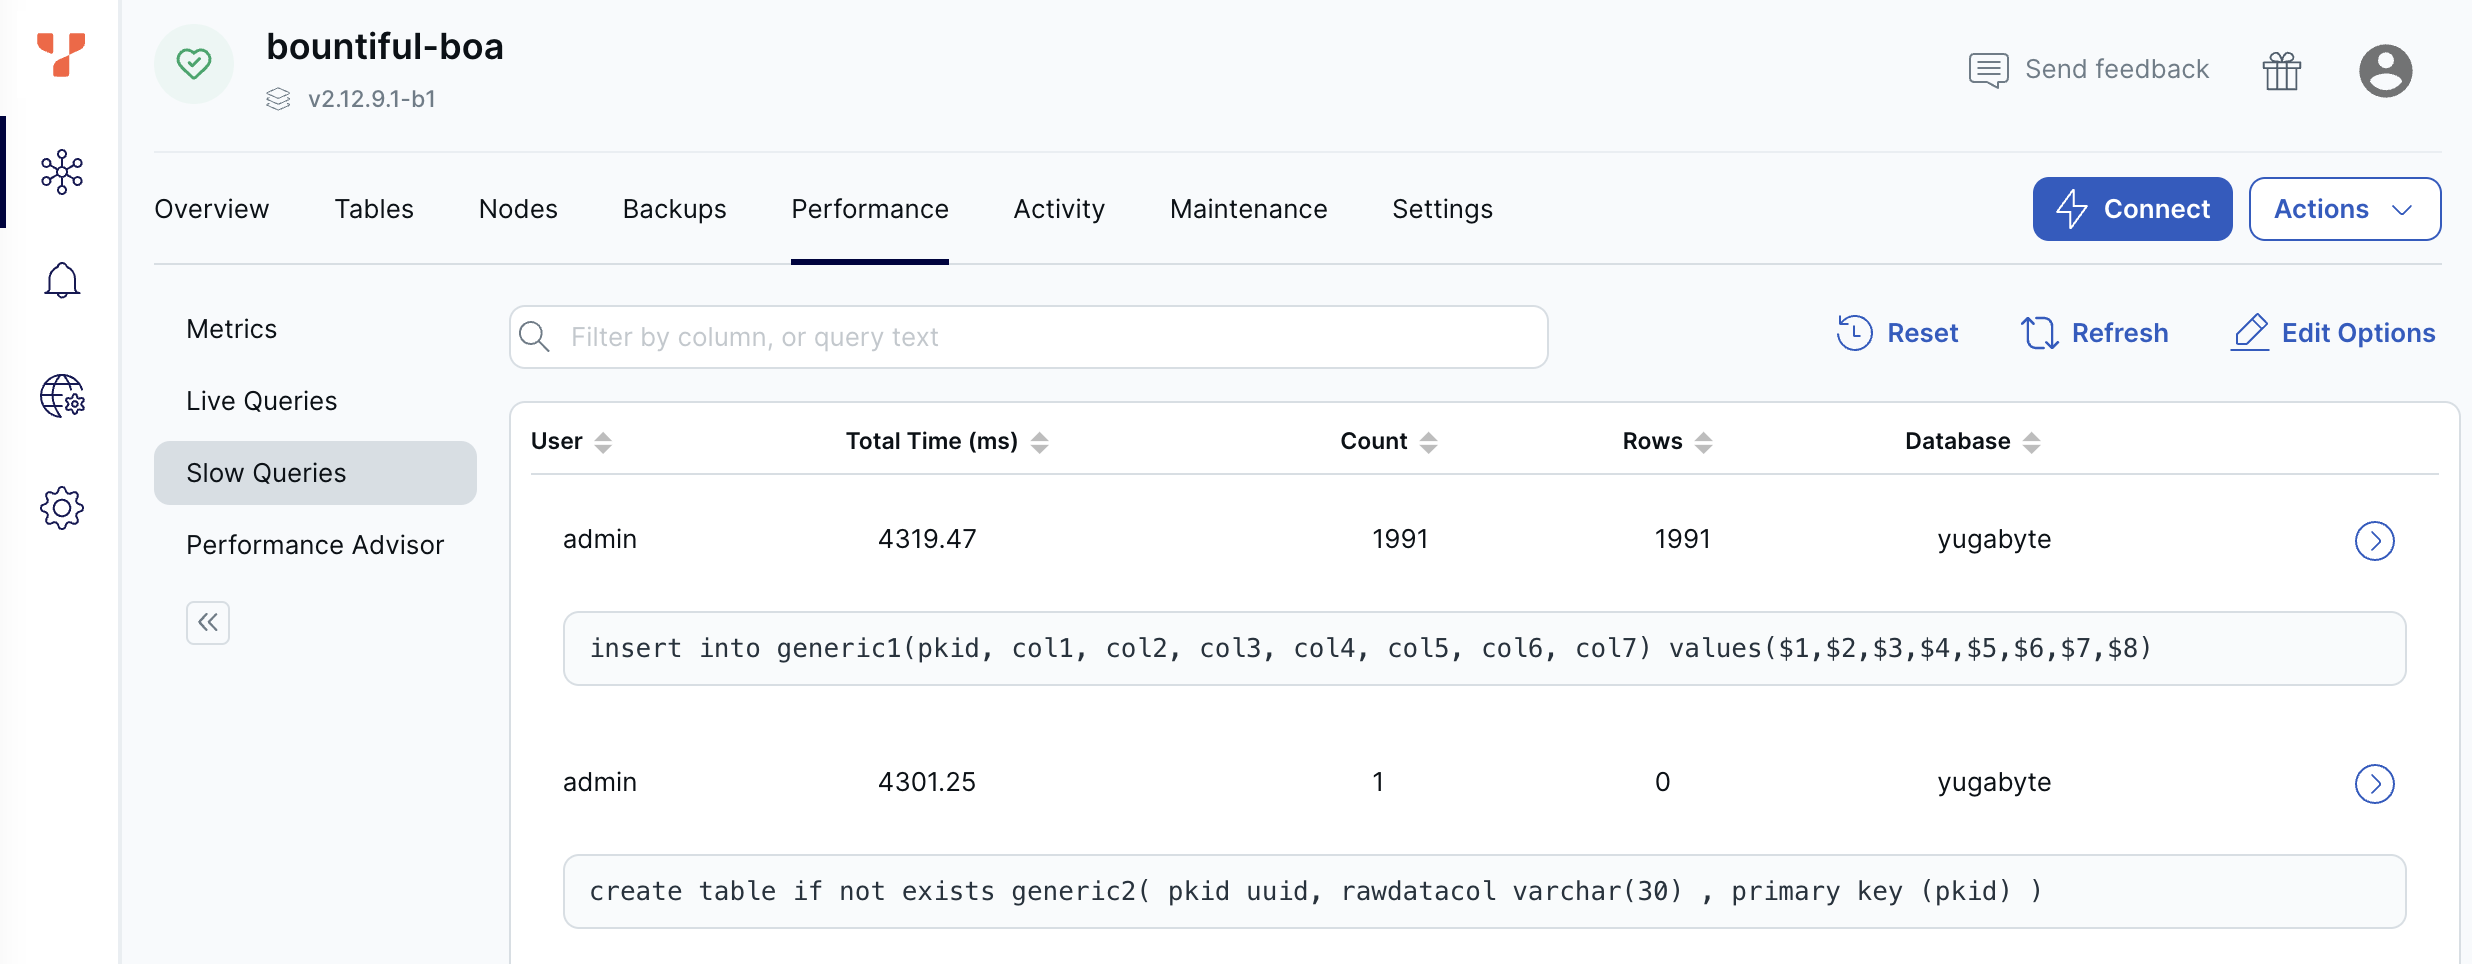
View slow queries
View slow running queries that have run on your cluster
Evaluate the performance of slow queries that have run on your cluster using the Slow Queries option on the cluster Performance tab. Use this data to:
- Visually identify slower running database operations.
- Evaluate query execution times over time.
- Discover potential queries for tuning.
Slow queries are not available for YCQL.

To filter the query list, enter query text in the filter field. To sort the list by column, click the column heading. Click Edit Options to select the columns to display.
To reset the slow queries list, click Reset.
To view query details, click the right-arrow button for the query in the list to display the Query Details sheet.
The following table describes the Slow Queries column values.
| Column | Description |
|---|---|
| User | The name of role used to access YSQL database. |
| Total time | The total duration (in milliseconds) of all iterations this query has taken. |
| Count | The total number of times this type of query has executed. |
| Rows | The total number of database table rows returned across all iterations of this query |
| Database | The YSQL database used by the query. |